
Institutional Financial Models, Excel Templates & Guides
Download battle-tested Excel templates, 3-statement financial models, valuation worksheets, Power BI themes, and formula cheat sheets crafted to institutional standards.
XLTips 30 Minute Pivot Practice Beginner
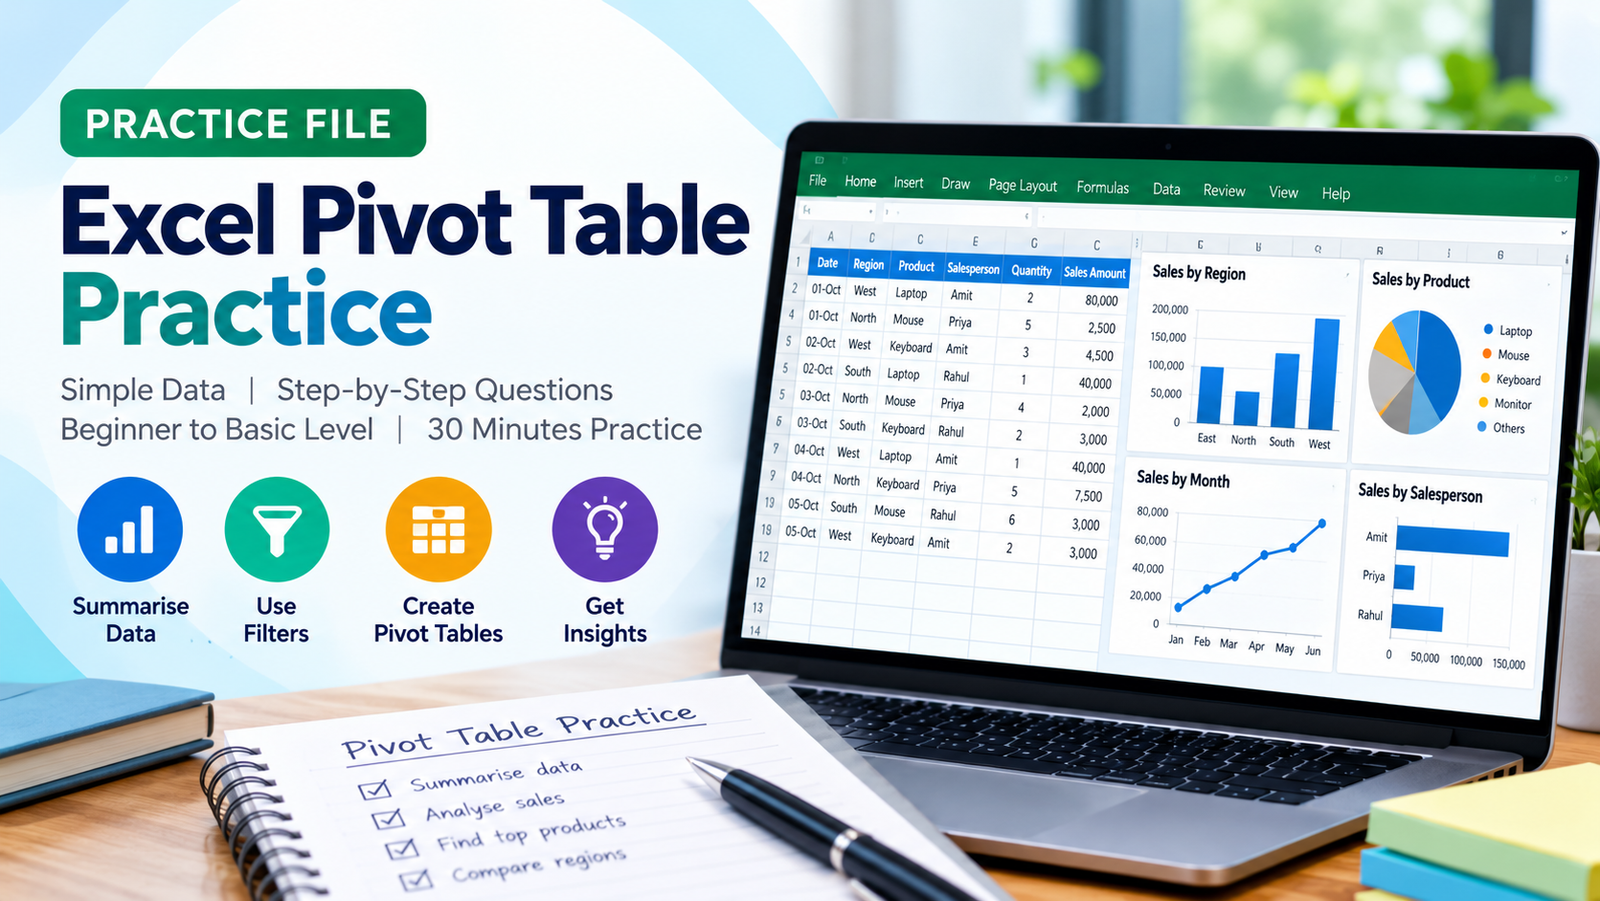
Excel Pivot Table – 30 Minutes Practical Exercise Learn how to analyse and summarise sales data using Microsoft Excel Pivot Tables through this hands-on practical session. This beginner-friendly exercise is designed to help you understand Pivot Tables by working with simple, real-world sales records. What You Will Practise: Create your first Pivot Table. Summarise sales by salesperson and region. Analyse product-wise sales and quantities. Calculate average sales and count records. Compare regions and products. Apply basic filters and sorting. Analyse multiple values in one Pivot Table. Practice Details: Duration: 30 Minutes Level: Beginner to Basic Intermediate Software: Microsoft Excel Format: Practical, step-by-step exercises Total Questions: 10 Learning Outcome: By completing this exercise, you will understand how to create Pivot Tables, organise data, generate summaries and extract useful business insights without manually calculating totals. Instruction: Open the Practice Data sheet and complete the questions in the Practice Session sheet. Try solving the exercises independently before checking the answers.