
Institutional Financial Models, Excel Templates & Guides
Download battle-tested Excel templates, 3-statement financial models, valuation worksheets, Power BI themes, and formula cheat sheets crafted to institutional standards.
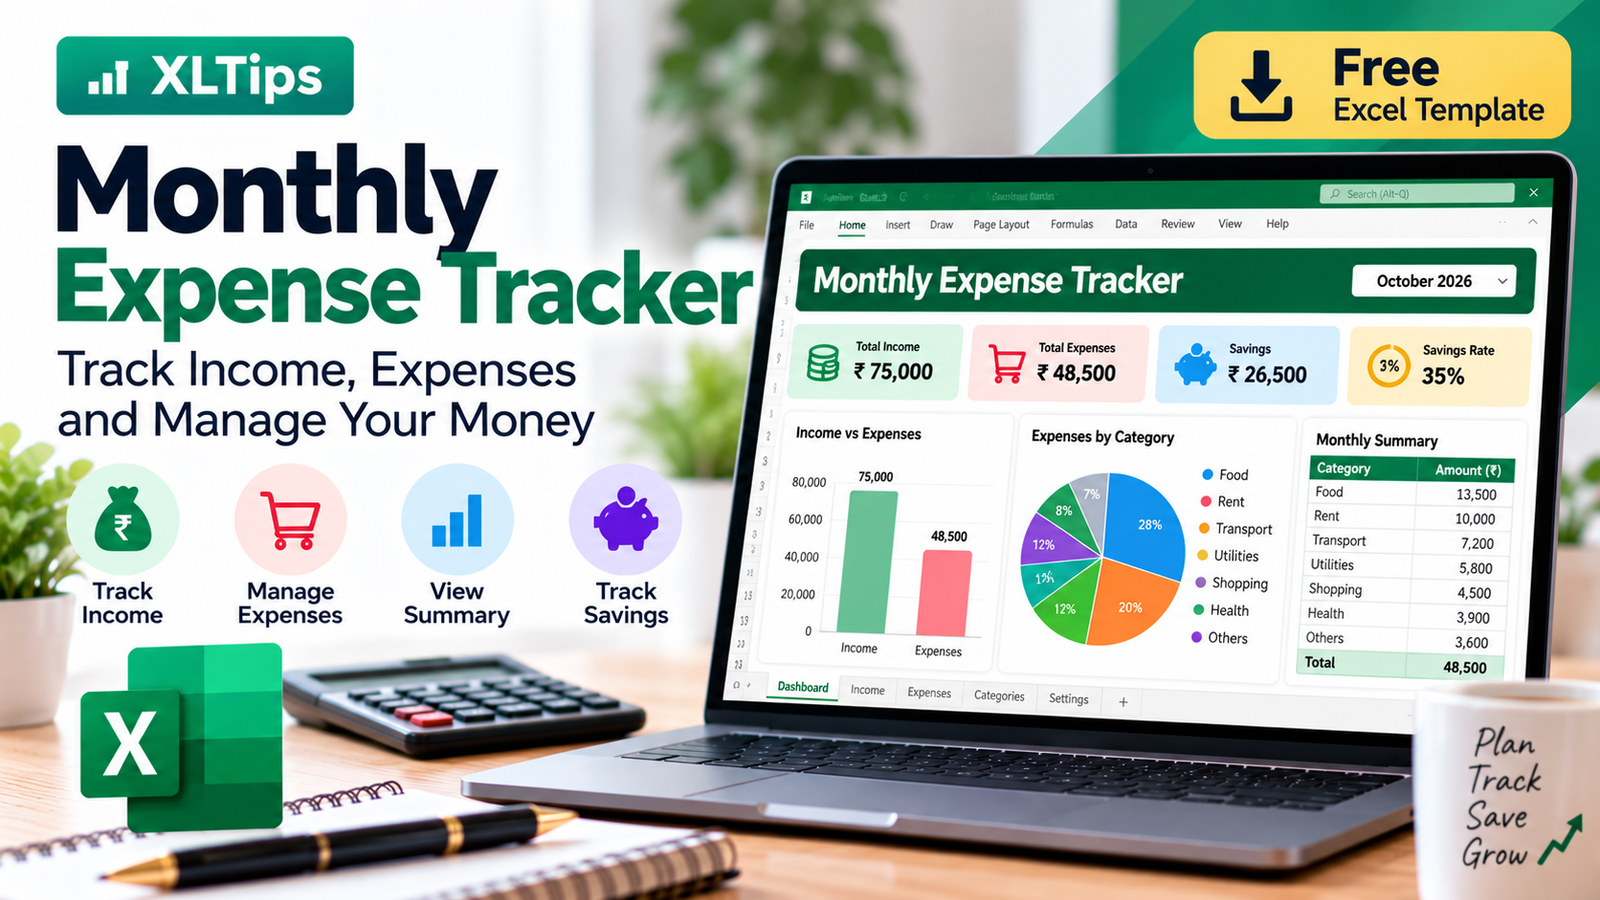
Monthly Expense Tracker Excel Template
Track your monthly income, expenses, and savings with this easy-to-use Excel template. Includes automatic calculations and an expense summary.
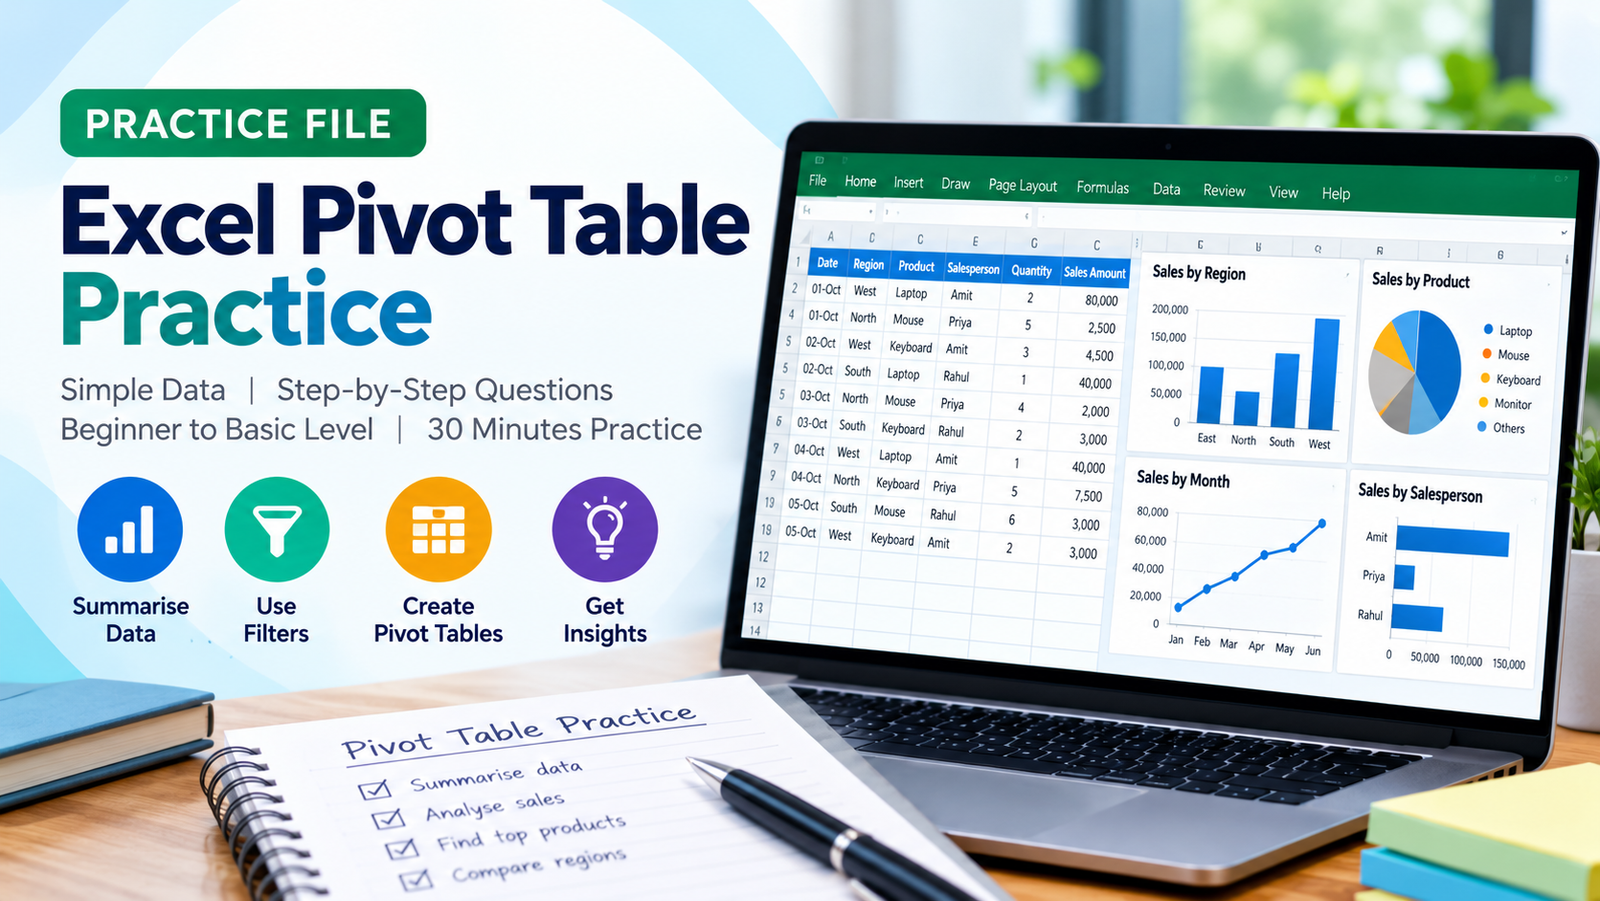
XLTips 30 Minute Pivot Practice Beginner
Excel Pivot Table – 30 Minutes Practical Exercise Learn how to analyse and summarise sales data using Microsoft Excel Pivot Tables through this hands-on practical session. This beginner-friendly exercise is designed to help you understand Pivot Tables by working with simple, real-world sales records. What You Will Practise: Create your first Pivot Table. Summarise sales by salesperson and region. Analyse product-wise sales and quantities. Calculate average sales and count records. Compare regions and products. Apply basic filters and sorting. Analyse multiple values in one Pivot Table. Practice Details: Duration: 30 Minutes Level: Beginner to Basic Intermediate Software: Microsoft Excel Format: Practical, step-by-step exercises Total Questions: 10 Learning Outcome: By completing this exercise, you will understand how to create Pivot Tables, organise data, generate summaries and extract useful business insights without manually calculating totals. Instruction: Open the Practice Data sheet and complete the questions in the Practice Session sheet. Try solving the exercises independently before checking the answers.