
Data Analysis, Power BI, DAX
·
2 MIN READ
·
October 26, 2026
Power BI for Beginners: Create Your First Dashboard
Ha
Harshad Patel
Chief Academic Officer & Master Financial Modeler
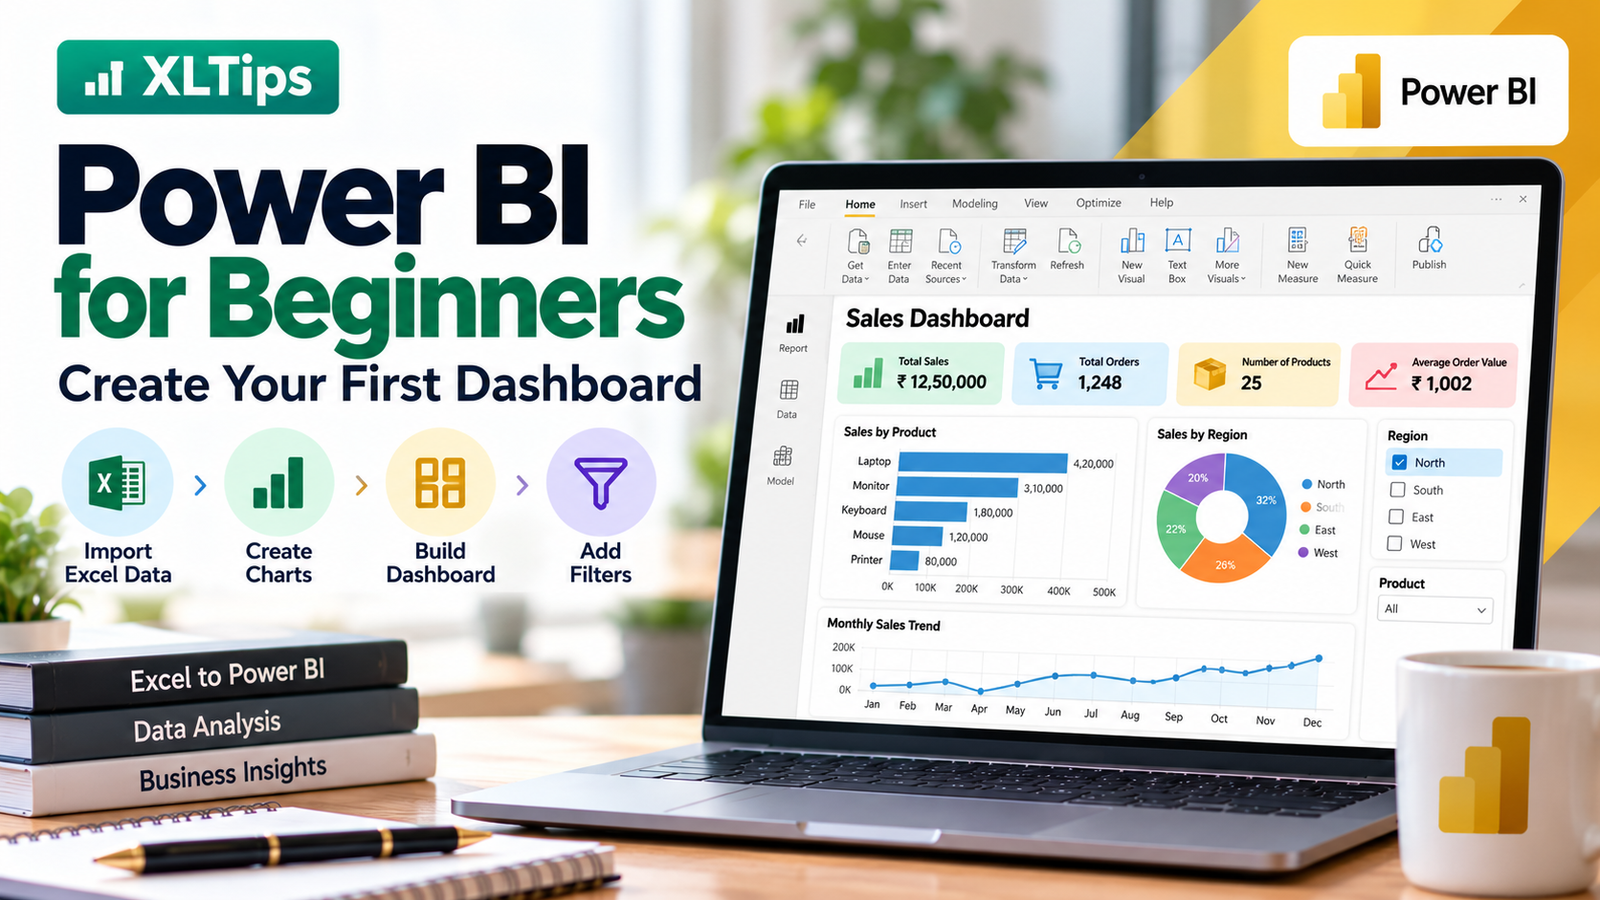
Power BI for Beginners: Create Your First Dashboard
Do you use Excel to prepare reports every day? Power BI can help you turn your data into interactive dashboards and visual reports.
You can use Power BI to analyze sales, expenses, customer performance, inventory, and business results.
1. What Is Power BI?
Power BI is a Microsoft tool used to analyze data and create interactive reports.
It helps you:
Create charts and graphs.
Track business performance.
Combine data from different sources.
Build interactive dashboards.
Share reports with others.
2. Prepare Your Excel Data
Before importing data, make sure your Excel file is organized.
For example:
Product
Region
Sales
Laptop
North
50,000
Monitor
South
30,000
Keyboard
East
20,000
Mouse
West
15,000
Keep clear column headings and avoid unnecessary blank rows or columns.
3. Import Data into Power BI
Follow these steps:
Open Power BI Desktop.
Select Get Data.
Choose Excel Workbook.
Select your Excel file.
Choose the required worksheet or table.
Select Load.
Your data is now available for building a report.
4. Create Your First Chart
To create a sales chart:
Select a bar chart from the Visualizations pane.
Add Product to the category axis.
Add Sales to the values field.
Adjust the chart title and formatting.
You now have a visual comparison of sales by product.
5. Add Useful Dashboard Cards
You can add cards to display important business numbers, such as:
Total Sales
Total Orders
Number of Products
Average Sales
These indicators help users understand business performance quickly.
6. Add Interactive Filters
Use a slicer to allow users to filter data by region, product, or date.
For example, selecting North will show the relevant sales figures for that region in visuals connected to the slicer.
7. Save and Share Your Report
Save your report as a Power BI Desktop file (.pbix).
To publish and share reports online, you can use the Power BI service, subject to the relevant licensing and sharing permissions.
Conclusion
Power BI makes it easier to transform raw data into clear and interactive reports.
Start with a simple Excel file, create a few charts, add useful summary cards, and practise using filters.
Once you understand the basics, you can explore data cleaning with Power Query, data relationships, and DAX formulas.
Learn practical Excel, Power BI, and business analytics skills with XLTips!